Most San Diego homeowners lose between 3% and 7% of annual solar output to dirty panels, and that number climbs fast during the long dry stretch from May through October. In dusty inland or near-agricultural areas, short-term losses can push into the 15-25% range after extended no-rain periods.
That’s the short answer. The rest of this post shows you where those numbers come from, what they mean for your utility bill, and how to know when your system needs attention.
How we estimate the loss
These figures come primarily from field research published by the National Renewable Energy Laboratory (NREL). Their soiling loss studies track actual panel output across U.S. sites and compare monitored production against clean-panel baselines. Researchers measure “soiling ratio”, how much a dirty panel produces relative to a reference clean panel under identical conditions.
Key assumptions used throughout this post:
- System size: 6-8 kW residential (typical San Diego install)
- Annual production baseline: 9,000-11,000 kWh/year (assumes ~1,400-1,500 peak sun hours, no shading losses beyond soiling)
- SDG&E rate used: $0.43/kWh blended estimate under current time-of-use schedules (check SDG&E’s current rate schedule for your actual tier)
- Dollar figures are estimates, not guarantees. Your real-world loss depends on your specific location, panel tilt, last cleaning date, and local dust sources.
NREL’s data shows soiling loss varies enormously by site. A panel near the coast sees different contamination than one a mile from a horse ranch in Ramona.
Soiling loss by location type in San Diego County
Not all San Diego locations are equal. Here’s how NREL-aligned field data breaks down across the three main environment types in this region:
| Environment | Typical annual soiling loss | Main contaminants |
|---|---|---|
| Coastal (La Jolla, Carlsbad, Chula Vista) | 3-5% | Salt film, marine aerosol, bird debris |
| Inland urban/suburban (El Cajon, Santee, Spring Valley) | 4-7% | Dust, smog particulates, pollen |
| Near-agricultural or rural (Ramona, Valley Center, Fallbrook) | 6-10%+ | Soil dust, agricultural particulates, ash events |
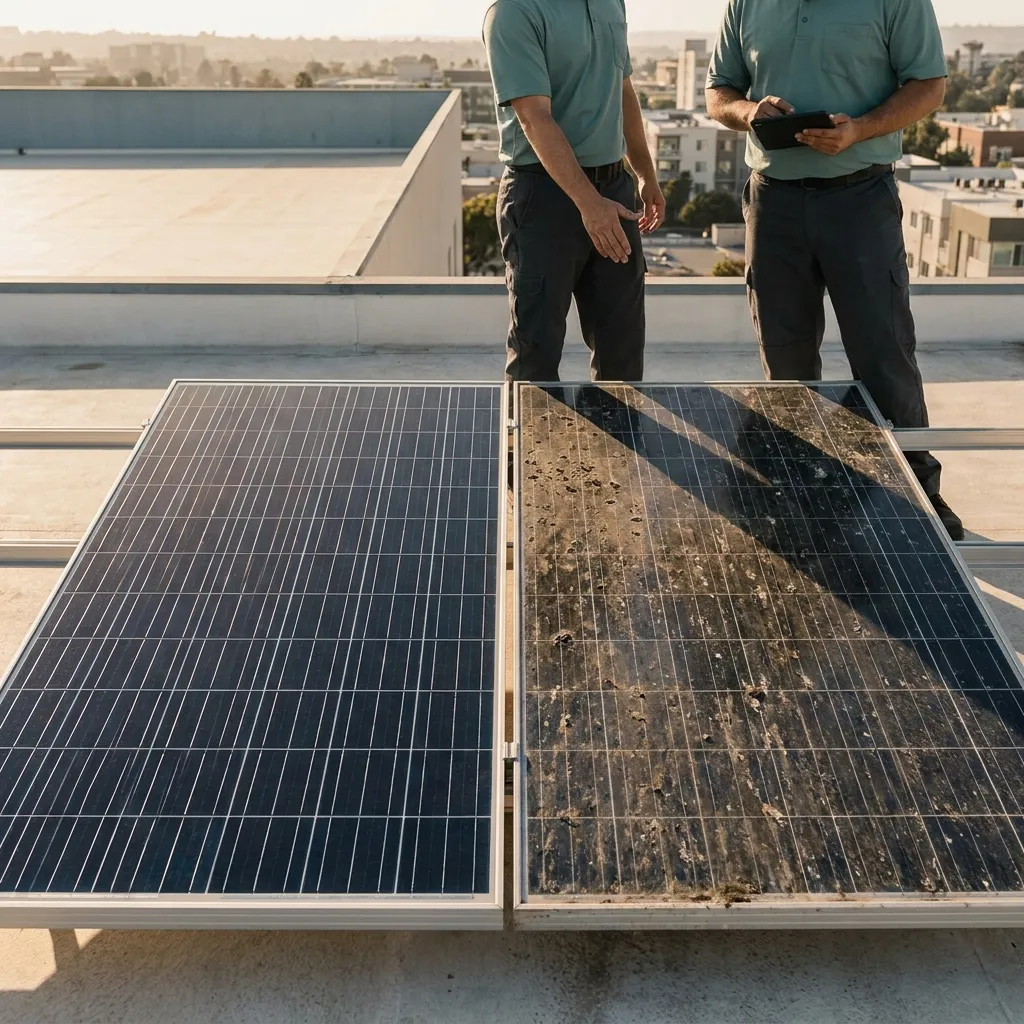
Coastal salt film is deceptive, it builds as a thin haze that’s nearly invisible but blocks light consistently. Inland dust is more visible but also partly natural-rain-recoverable. Near-agricultural zones can spike sharply after dry wind events.
What happens during San Diego’s dry season
San Diego gets most of its rainfall between November and April. From late May through October, roughly five months, natural rainfall is minimal or absent entirely. During that window, panels accumulate soiling with no natural rinse cycle.
NREL field measurements show soiling rates in arid and semi-arid climates of roughly 0.1-0.3% per day in typical conditions. At that pace, a panel that was clean in May can be carrying 10-15% soiling loss by September, before a single drop of rain.
After Santa Ana wind events or wildfire smoke periods (which San Diego sees regularly in late summer and fall), short-term soiling can spike into the 15-25% range. NREL cites this upper band for heavily soiled panels, and it’s realistic here given the region’s climate and fire activity.
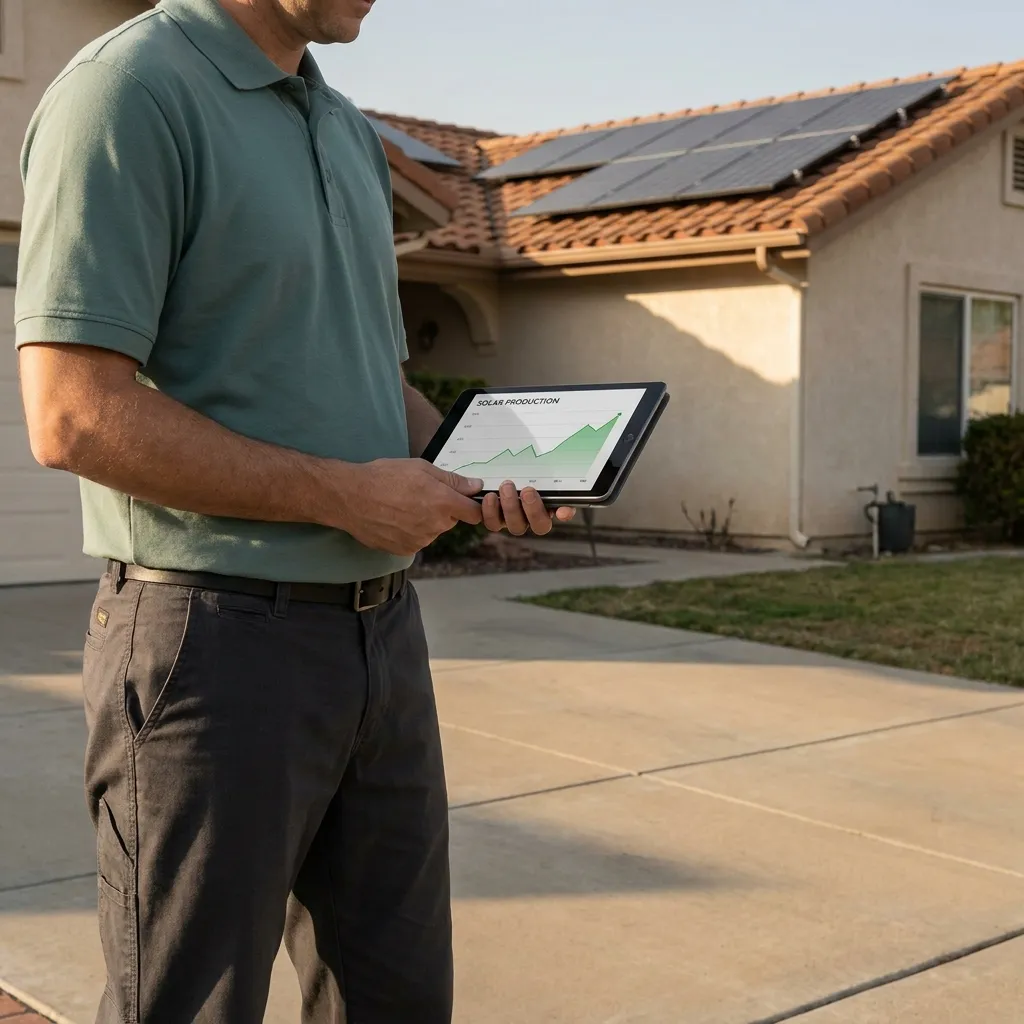
If you want to see how your system is tracking, our performance monitoring service compares your actual production against your system’s expected output so you can catch soiling loss in real time.
What soiling loss actually costs per year
Here’s the math made transparent. Assumptions are stated so you can adjust for your own situation.
Baseline scenario: 7 kW system, 10,000 kWh/year, $0.43/kWh average rate
| Annual soiling loss | kWh lost per year | Estimated $ lost per year |
|---|---|---|
| 3% (low-end typical) | 300 kWh | ~$129 |
| 5% (mid-range) | 500 kWh | ~$215 |
| 7% (upper typical) | 700 kWh | ~$301 |
| 15% (dry-season peak, inland) | 1,500 kWh | ~$645 |
| 25% (worst-case neglected panels) | 2,500 kWh | ~$1,075 |
A 5% loss on a 7 kW system costs roughly $215 per year in production you paid for but aren’t getting. Over a 10-year stretch, that’s $2,000+ at today’s rates, before accounting for rate increases.
Pair that against the cost of a professional cleaning and the math becomes straightforward. See our solar panel cleaning cost breakdown for San Diego for current pricing.
Does rain clean solar panels enough?
Partly. Light rainfall can remove loose surface dust, but it doesn’t address:
- Salt film from marine air (requires scrubbing to break the bond)
- Bird droppings (partially rain-resistant, create concentrated shading hot spots)
- Pollen and biological debris that becomes sticky when wet then dries hard
- Fine particulate matter that compresses into a film over time
Research on rainfall as a cleaning mechanism finds it effective only for loose, low-density soiling. San Diego’s rain also tends to come in short intense bursts that can leave muddy residue rather than clean panels. Hard water spotting from sprinkler overspray is a separate issue entirely.
For more on how often San Diego panels actually need cleaning, factoring in location, tilt, and rainfall, read how often to clean solar panels in San Diego.
Does cleaning actually recover the lost production?
Yes, in most cases, professional cleaning restores the majority of soiling-related loss. NREL field data consistently shows production rebounds close to clean-panel baselines after washing. The key word is “professional.” DIY cleaning with a garden hose can leave mineral deposits or fail to remove salt film, so the recovery is partial.
A full wash with deionized or reverse-osmosis water and soft brush technique removes the contaminants that rainfall and tap water leave behind. Our solar panel cleaning service uses that process specifically because it’s what the production data supports.
The does cleaning increase solar output in San Diego post walks through the production comparison in more detail.
How to know if your panels are losing production right now
Three signals to watch:
1. Monitor your inverter app. Most modern inverters (Enphase, SolarEdge, SMA) show daily production history. If your output this week is meaningfully lower than the same week last year, and there’s no obvious weather explanation, soiling is a likely cause.
2. Look at your SDG&E bill. If you’re drawing more from the grid than usual during peak hours despite similar weather, your panels may not be producing at capacity.
3. Visual inspection. On a clear day, look at your panels from ground level. A hazy or matte appearance instead of a clean reflective surface is a strong indicator of buildup. Bird droppings are visible as white spots, and any concentrated soiling creates a hot-spot shading effect that’s disproportionate to its size.
Our solar maintenance plan includes scheduled production checks alongside cleaning so you’re not guessing.
When to call us
If your system is three or more months into San Diego’s dry season without a cleaning, it’s worth a production check. If you’re near the coast, near any agricultural land, or if your panels have visible debris, the case for cleaning is stronger.
Call us at (858) 925-5546 for a free production check. We’ll look at your monitoring data, give you an honest read on likely soiling loss, and tell you whether a cleaning makes financial sense right now, not just tell you yes regardless.